Autochartlist
Our industry-leading charts* provide a host of features to support your analysis,including multiple chart types,over 115 technical indicators and drawing tools,pattern recognition, and a chart forum community.
%20(1).avif)
.svg)
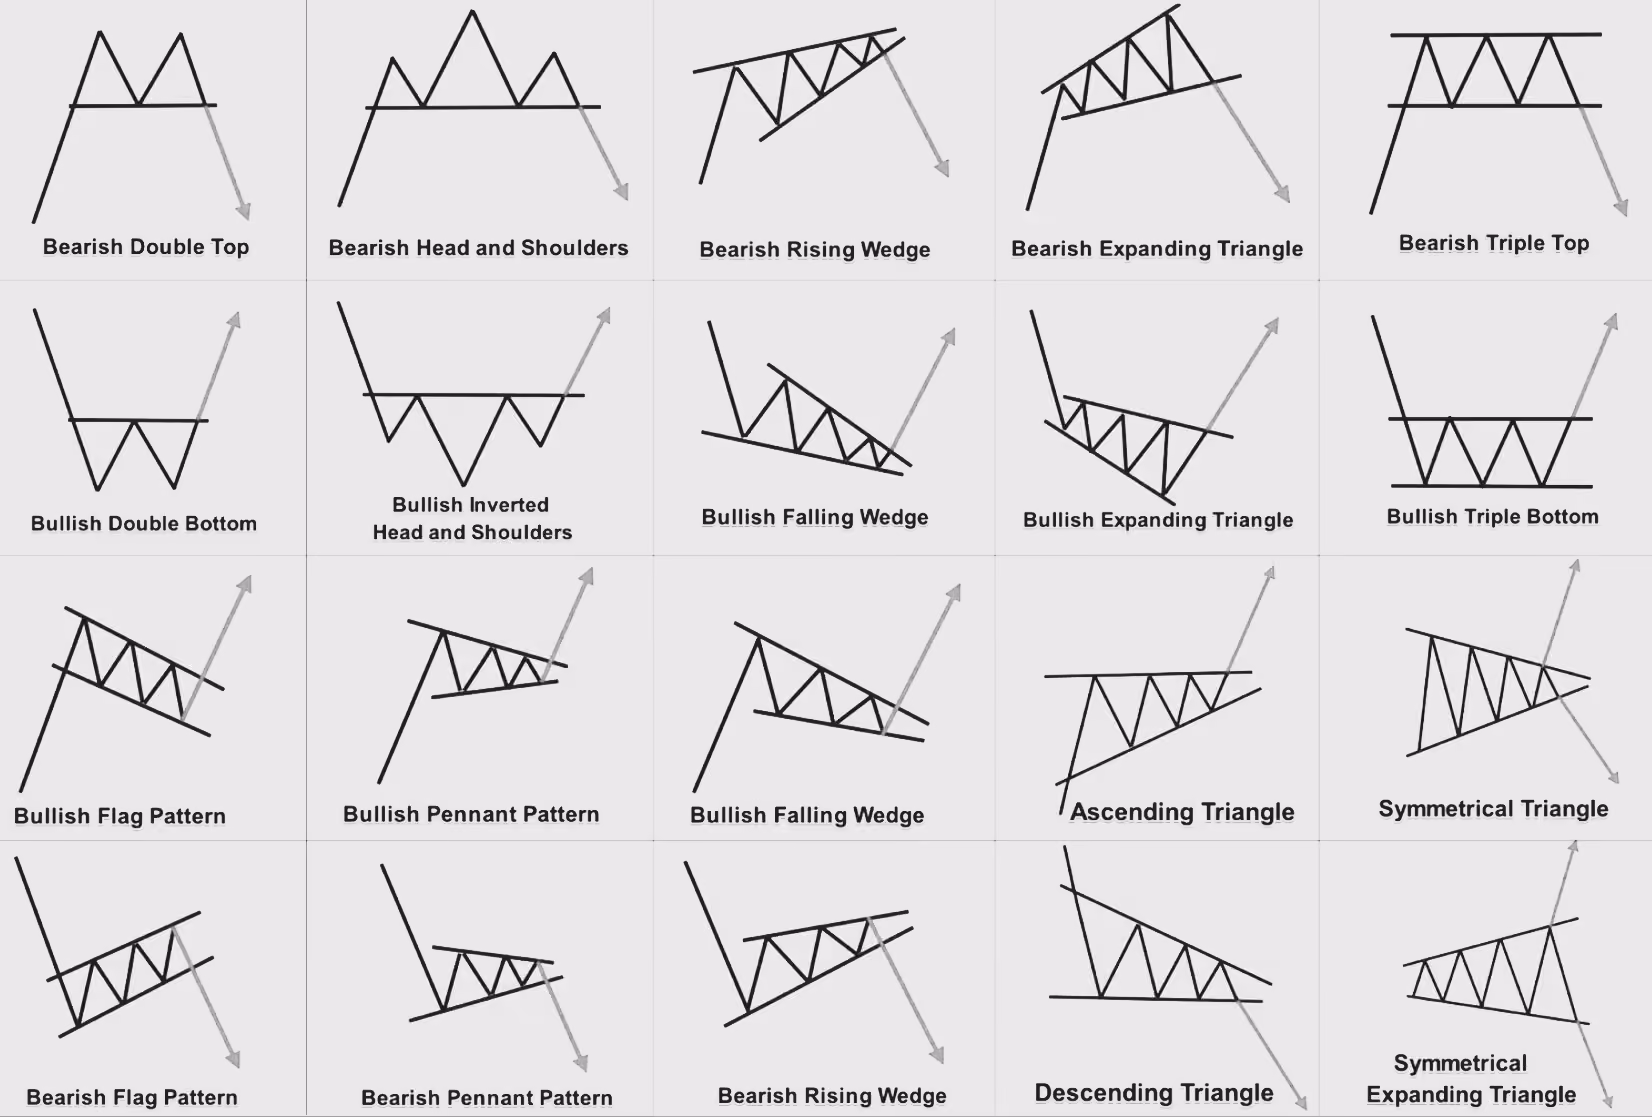
Chart Patterns
Autochartist automatically identifies Fibonacci patterns that can visually illustrate certain levels at which either support or resistance is anticipated, according to the Golden ratio theory. Levels like that can play any instrumental role in setting up stop-loss levels and identifying trading objectives.
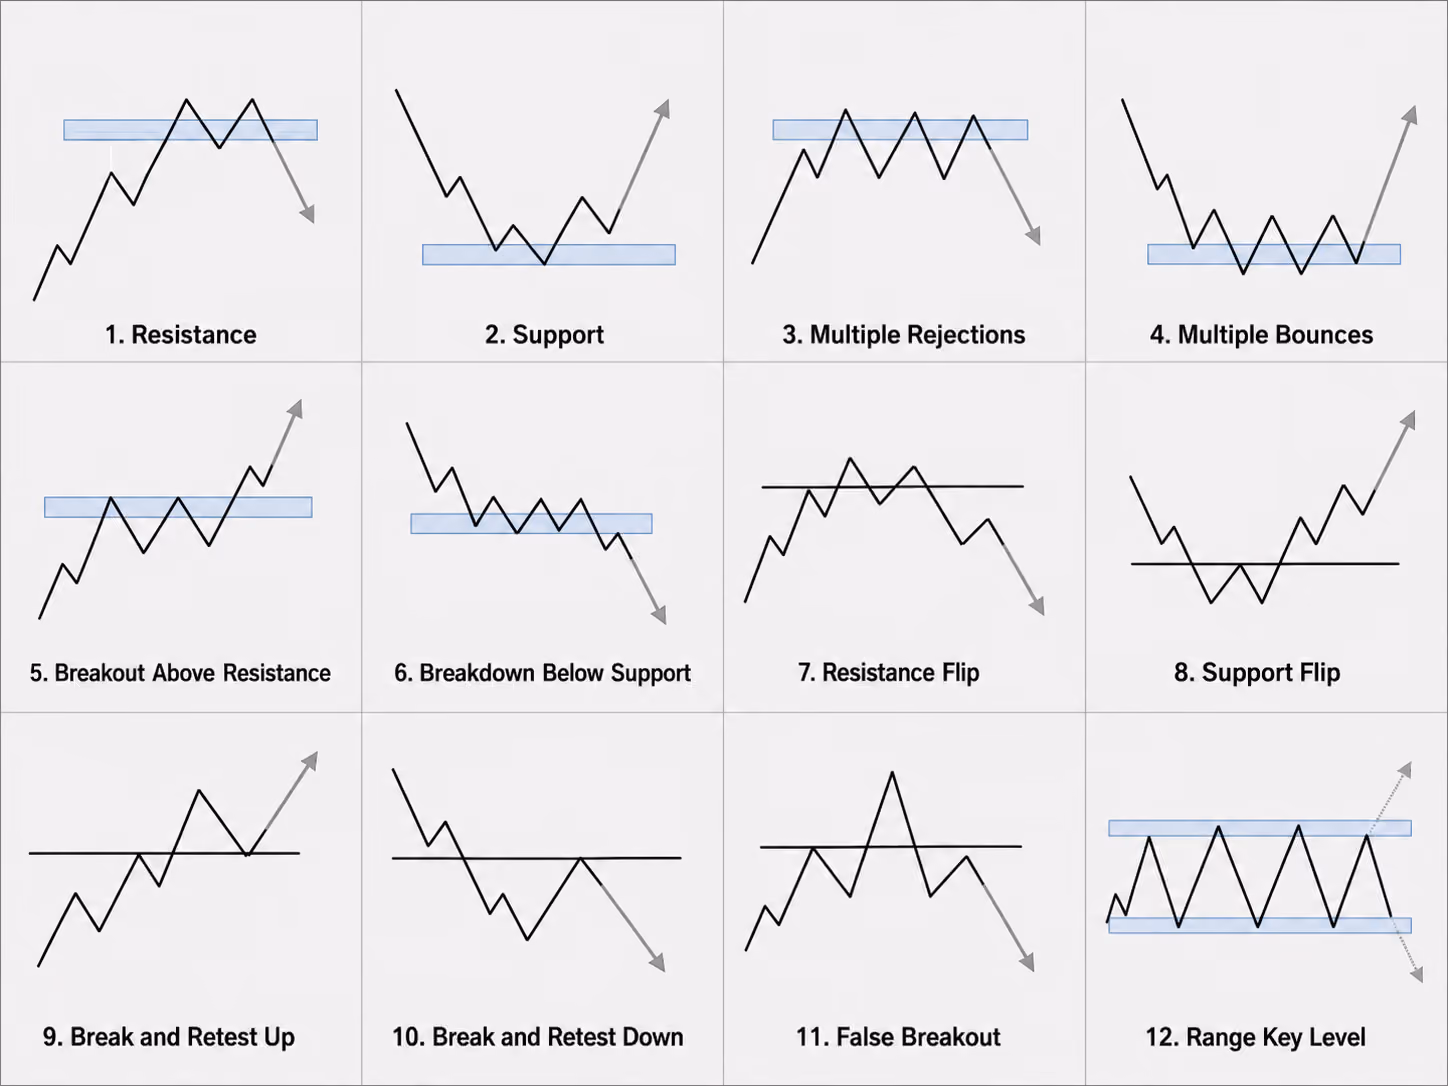
Horizontal Key Levels
Autochartist Key levels identify horizontal support or resistance levels at significant price levels. This is the most popular analysis type as it is loved by all types of traders. It is simple to understand and ideal for the new trader and very valuable for more experienced and advanced traders
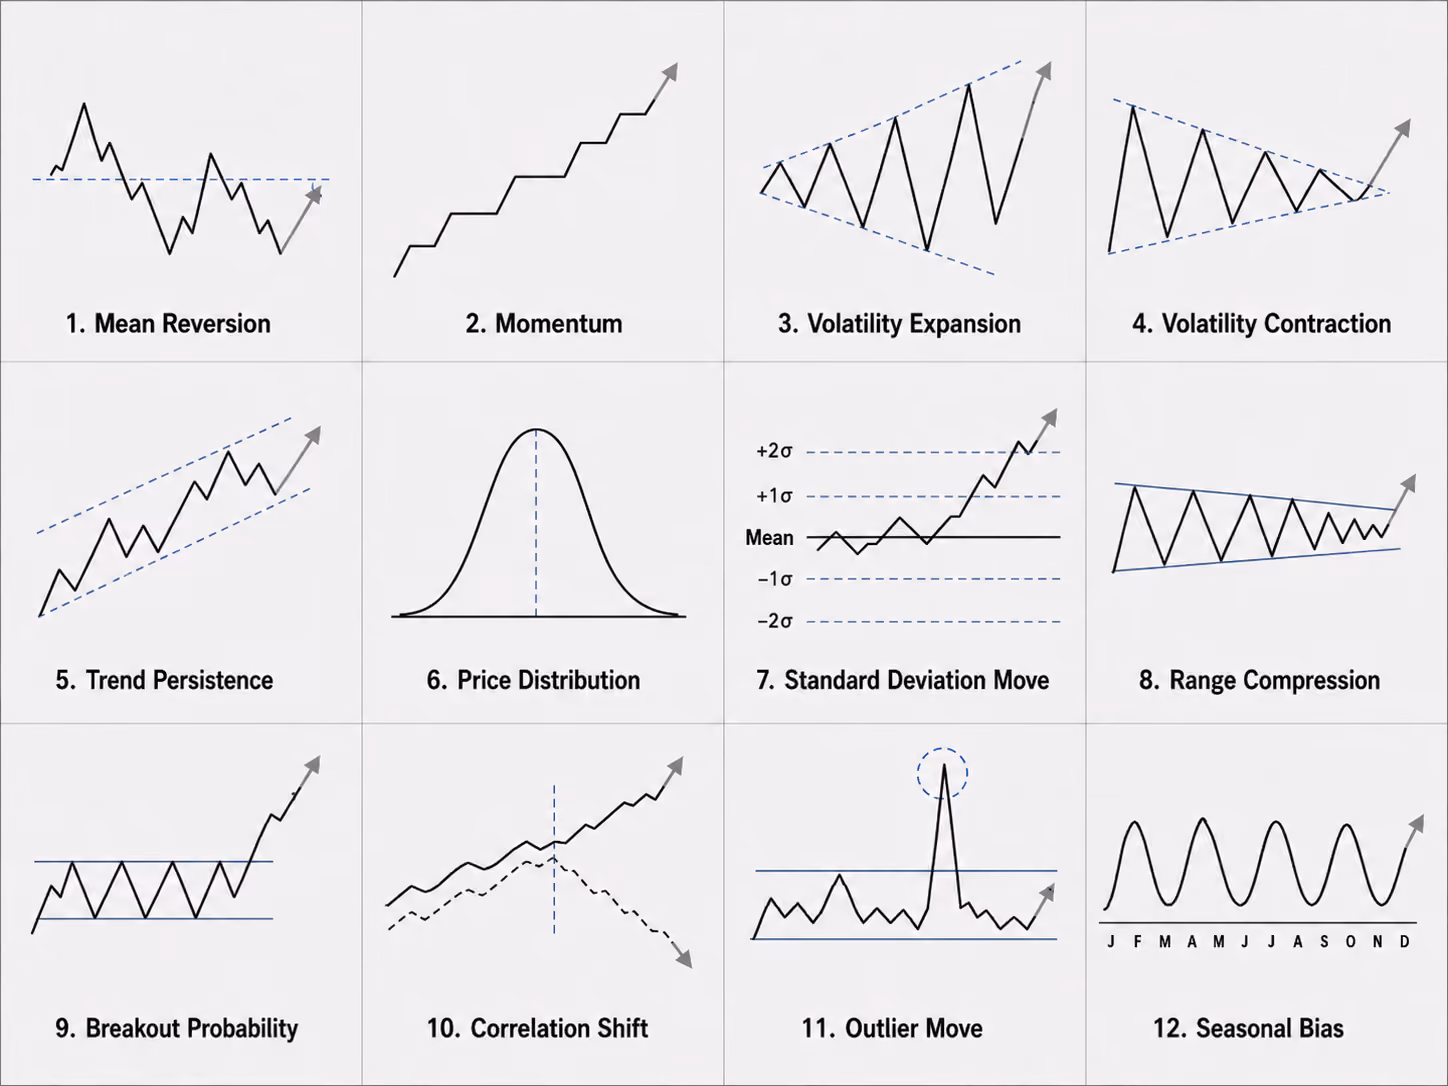
Statistical Patterns
Everyone wants to know where the exceptionally large movements in the markets are, as the question is always “What is going to happen next?”. The Autochartist Big Movements and Consecutive Candle statistical patterns automatically identify large movements in the market
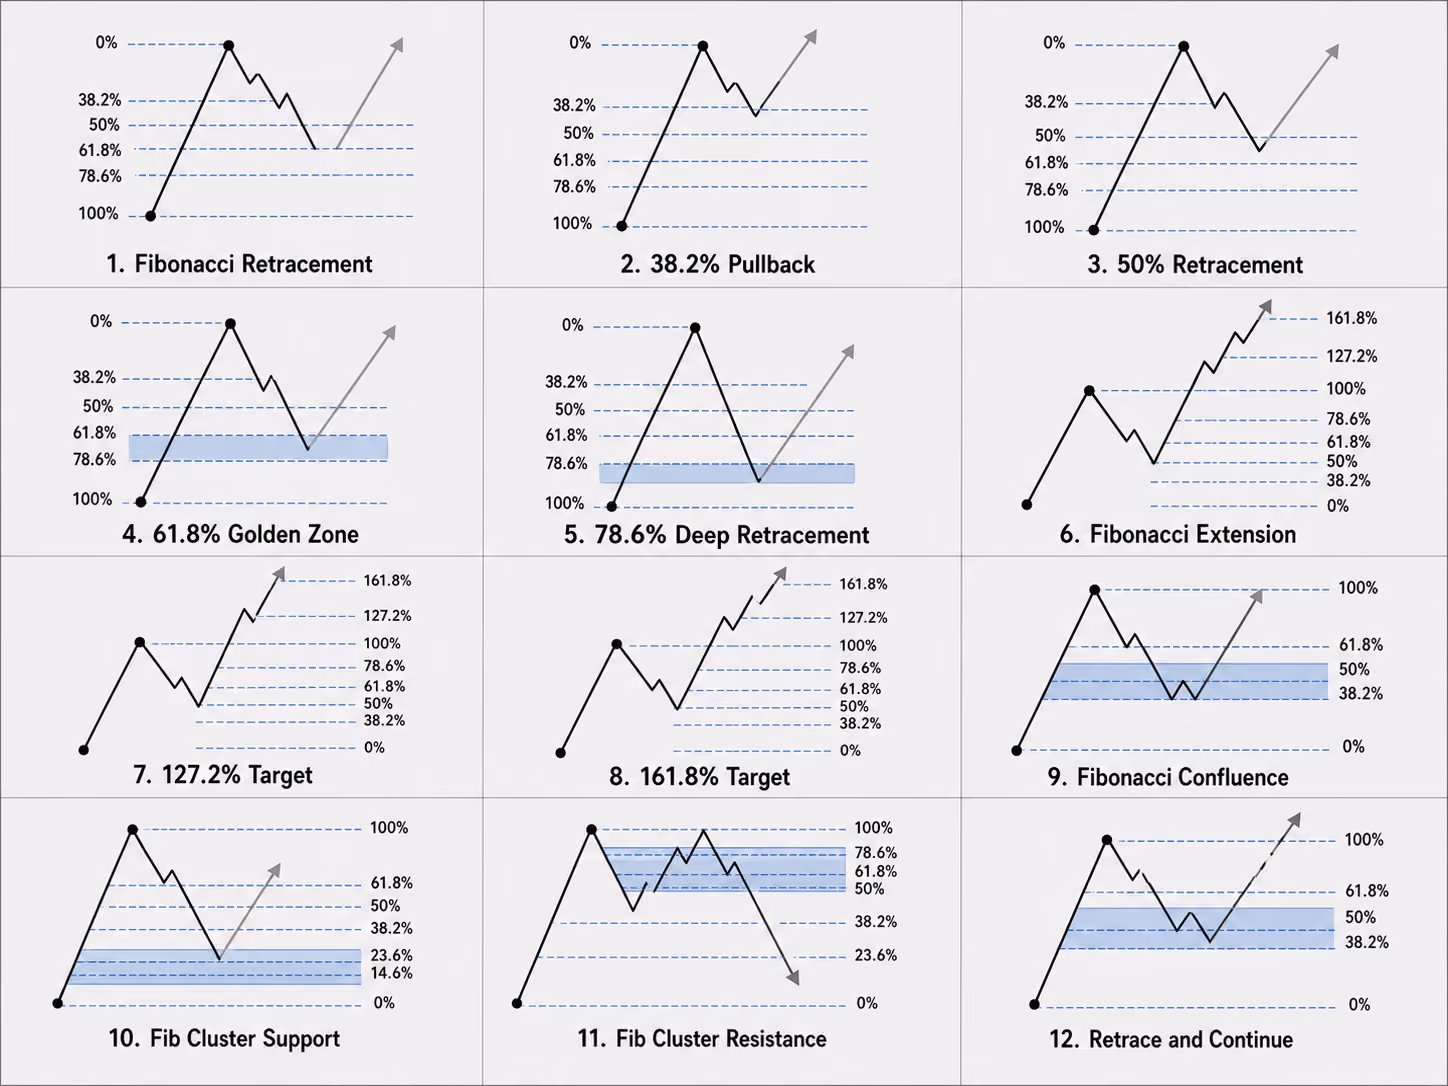
Fibonacci Patterns
Autochartist automatically identifies Fibonacci patterns that can visually illustrate certain levels at which either support or resistance is anticipated, according to the Golden ratio theory. Levels like that can play an instrumental role in setting up stop-loss levels and identifying trading objectives.
Contact Us
support@acg-markets.com


.svg)
